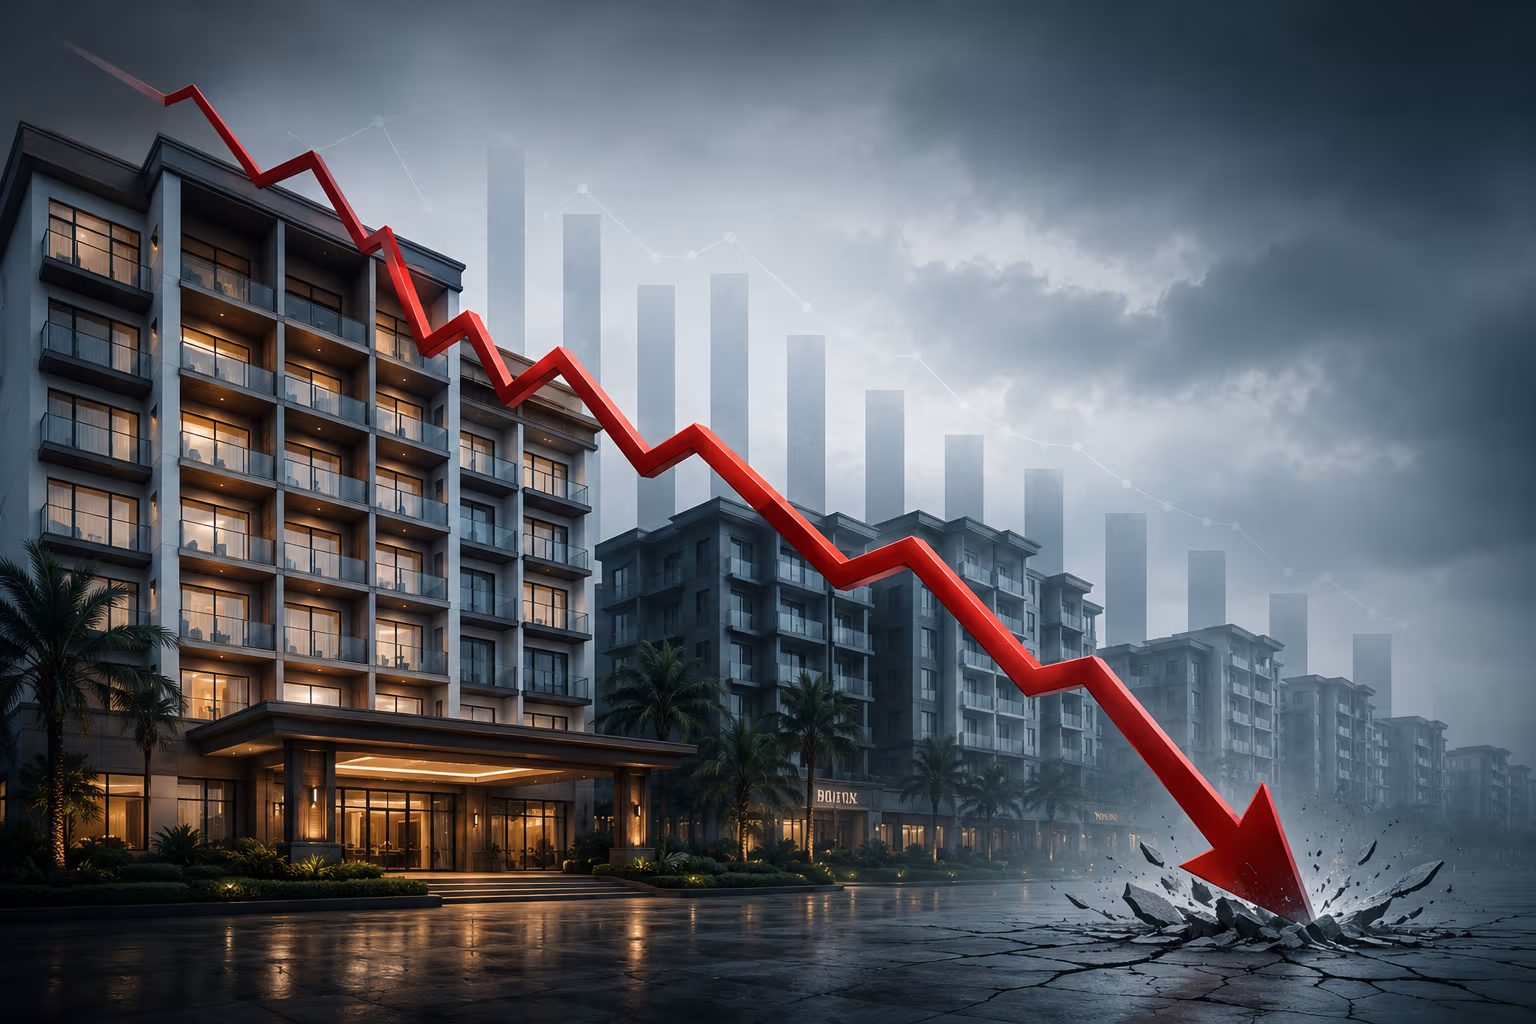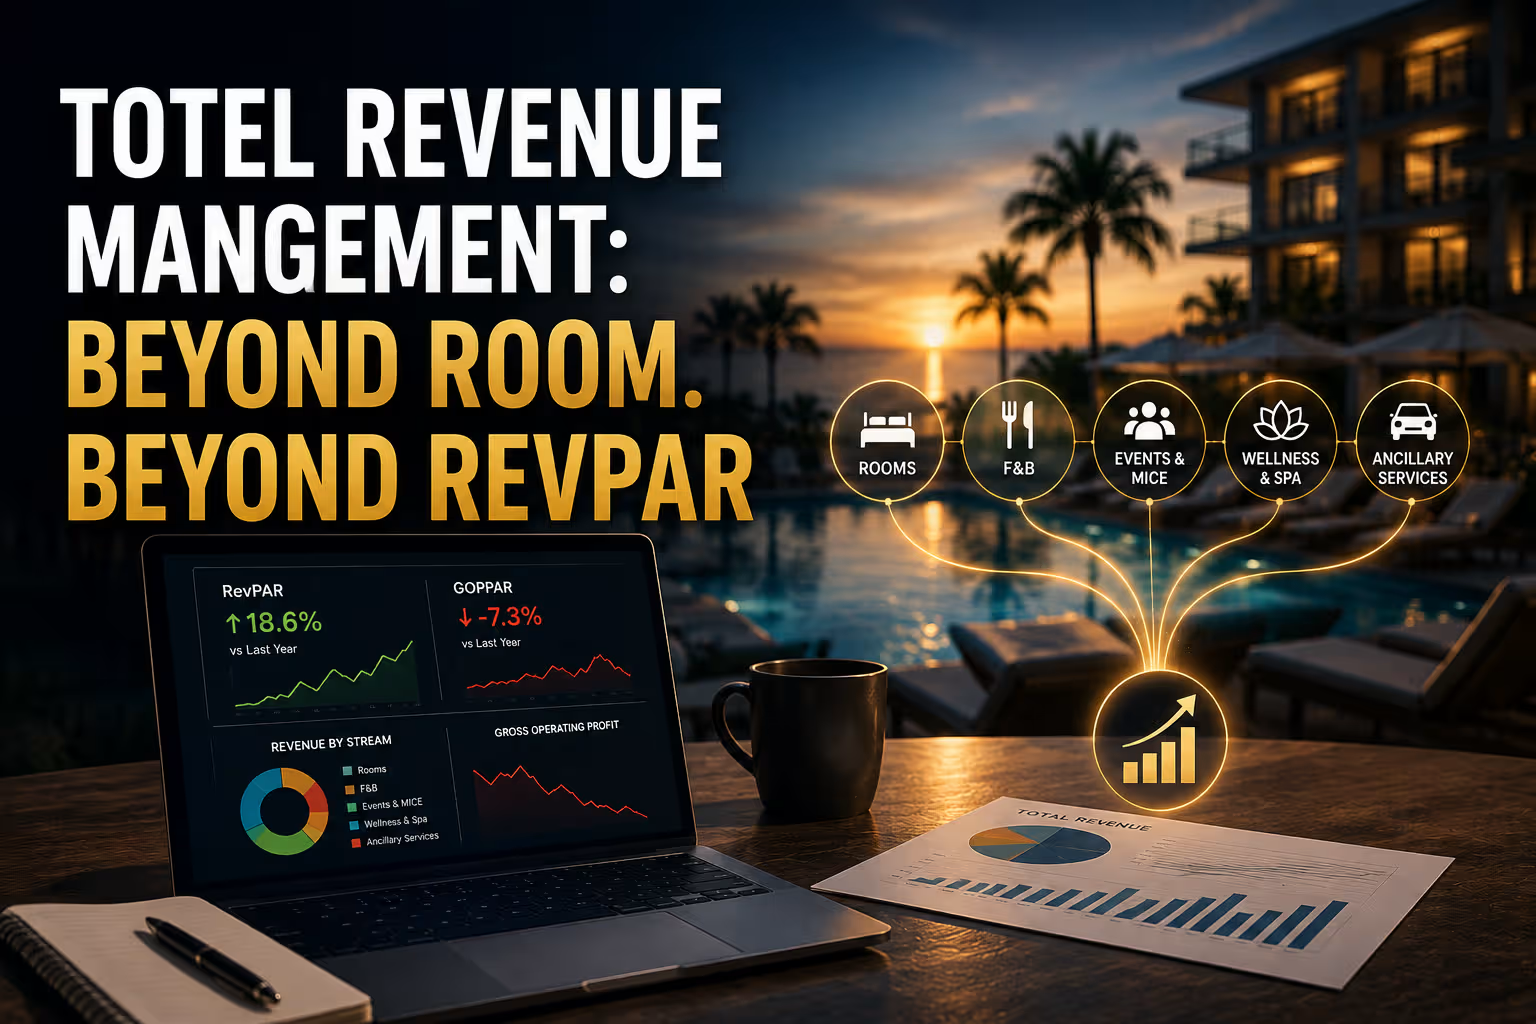


Key Takeaway: RevPAR and gross operating profit can, and frequently do, move in opposite directions, which means a commercial strategy built entirely around room revenue can be actively eroding the financial health of the asset it claims to protect.
The Record Quarter That Wasn't
Picture the morning briefing after a property's strongest RevPAR quarter in three years. Rooms were full. Average daily rate was up.
Then the finance team circulates the P&L.
Gross operating profit is down. Housekeeping overtime ran heavy. OTA commissions absorbed more than projected. The restaurant turned tables slowly on peak weekends. A large wedding buyout displaced a full weekend of high-rate transient bookings at a function space price that looked impressive on the contract but never covered the opportunity cost.
The property succeeded at optimizing for one metric. It failed at the thing the metric was supposed to represent.
This is the foundational problem with how most independent properties approach total revenue management: the metrics they're compensated on, the data systems they work with, and the organizational pressures they manage all point in the wrong direction.
Why RevPAR Has Become a Misleading Scorecard
RevPAR made sense in a world where OTA commissions were low, labor costs were predictable, and non-room revenue was secondary. None of those conditions apply now.
The mathematical relationship between RevPAR and gross operating profit is not fixed. Under specific variable cost structures and demand curve slopes, the two metrics move in opposite directions. The research underpinning TRM hospitality strategy puts this bluntly: optimizing for peak RevPAR can force GOPPAR to decrease. The industry has treated room revenue as a near-perfect proxy for financial health for decades. The empirical data proves this assumption is false.
The reason it continues is structural. Benchmarking tools are built around room revenue. Competitive set reports are built around RevPAR. Executive bonuses are tied to ADR and occupancy. Revenue managers rationally optimize for the metric they're evaluated on.
A veteran GM pushed back on this directly: RevPAR might be mathematically flawed, but it's the only metric that can actually be measured at the 8 AM briefing. GOPPAR requires synced POS data, real-time commission reconciliation, and accurate labor cost allocation. Most properties can't produce that in real time. So they use the number they have.
That's a fair operational point. It's also precisely why TRM implementation fails: the insight is correct, but the data infrastructure to act on it doesn't exist yet at most independent properties.
The Three Assets Nobody Is Yielding
Total revenue management is built on a simple premise: every physical asset in the property that produces revenue and has constrained capacity deserves the same analytical attention as the hotel room. In practice, three specific areas consistently go unmanaged.
Food and Beverage: The RevPASH Problem
The standard approach to restaurant pricing in most independent properties is a static menu. The same price for a dish at 7 AM and at 9 AM, on a Tuesday and on a Saturday, during a sold-out wedding weekend and during a slow monsoon week.
RevPASH (Revenue Per Available Seat Hour) reveals what this costs. The metric is calculated by dividing total outlet revenue by the product of available seats and opening hours. It exposes what's really happening: a restaurant that operates at peak capacity from 8:30 AM to 10:00 AM and sits nearly empty before and after is not running well. It's running one profitable hour surrounded by wasted capacity.
The textbook response would be to surge prices during peak hours. This almost never works in practice. Research on consumer psychology is consistent on this point: guests who happily accept that hotel room rates fluctuate by hundreds of rupees based on demand will react with genuine anger to a restaurant menu that charges more for a breakfast item on a Saturday. The perception of fairness is structurally different between room pricing and F&B pricing. Uber has successfully normalized surge pricing for transportation. The restaurant industry has not, and trying to force it creates the kind of review backlash that damages the entire property's reputation.
The solution isn't price manipulation. It's throughput engineering.
During peak dining windows, a strict 90-minute reservation limit increases table turns without touching the menu price. Table mix optimization (aligning physical table sizes with historical party-size demand, rather than seating two guests at a four-top) immediately improves seat utilization. QR-code ordering and pre-payment for large parties removes server bottlenecks and shaves meaningful time from each meal cycle. None of these changes appear on the menu. All of them improve RevPASH.
For Indian properties where weekend brunches and banquets are often the highest-revenue events of the week, these operational changes matter substantially. The F&B director who dismisses this as a hotel concern rather than a restaurant concern is leaving the most accessible non-room revenue optimization on the table.
Function Space: The Displacement Trap
When a large event inquiry arrives, the instinct is to close it. A confirmed booking feels secure. The sales director has a target. The contract gets signed.
The correct analysis is more uncomfortable. Every event that occupies significant function space and room blocks during a period of projected high transient demand requires a displacement calculation before the contract is offered. The research framework recommends running this analysis for any group or event inquiry that would occupy more than 15 percent of total inventory, comparing the net revenue the group will generate against the forecasted revenue from the transient demand it would displace.
The standard for accepting the group: the group's net contribution should exceed the displaced transient profit by a minimum multiplier. A group that merely matches displaced transient revenue is not a profitable decision. It's an even trade that requires significantly more operational effort to service.
In Indian leisure destinations, particularly in Rajasthan, Kerala, and Goa, this analysis matters most during peak season. Heritage properties and luxury resorts in these markets often derive 40 to 50 percent of total revenue from weddings and corporate events. When a multi-day wedding buyout is priced to compete for the contract rather than priced to reflect the true opportunity cost of the displacement, the resulting P&L shows it clearly. The problem is that the POS data needed to calculate the actual F&B profitability of servicing the event rarely syncs with the RMS in real time. So the displacement analysis uses historical averages rather than live demand signals, and the commercial decision is made on approximated data.
The interim solution isn't to abandon the analysis. It's to build a simple manual protocol. For any event inquiry that would block more than 15 percent of inventory on a date where occupancy is currently projected above 60 percent, the revenue manager and sales director must jointly complete a displacement worksheet before any rate is offered. Not after the contract is circulated. Before.
Distribution: The Cost Nobody Is Tracking Accurately
The headline commission rate a property pays to an OTA is almost never its actual cost of distribution.
In the Indian market, contracted base commissions of 18 to 25 percent are the starting point. The 18 percent GST levied on that commission amount is typically absorbed by the property, not reflected in the rate calculation. Mandatory visibility boosters, participation in platform loyalty discount programs, and TDS/TCS deductions all compound the effective acquisition cost. The research suggests the true effective cost of OTA acquisition for Indian independent properties frequently approaches 30 to 40 percent of gross booking value, once all layers are accounted for.
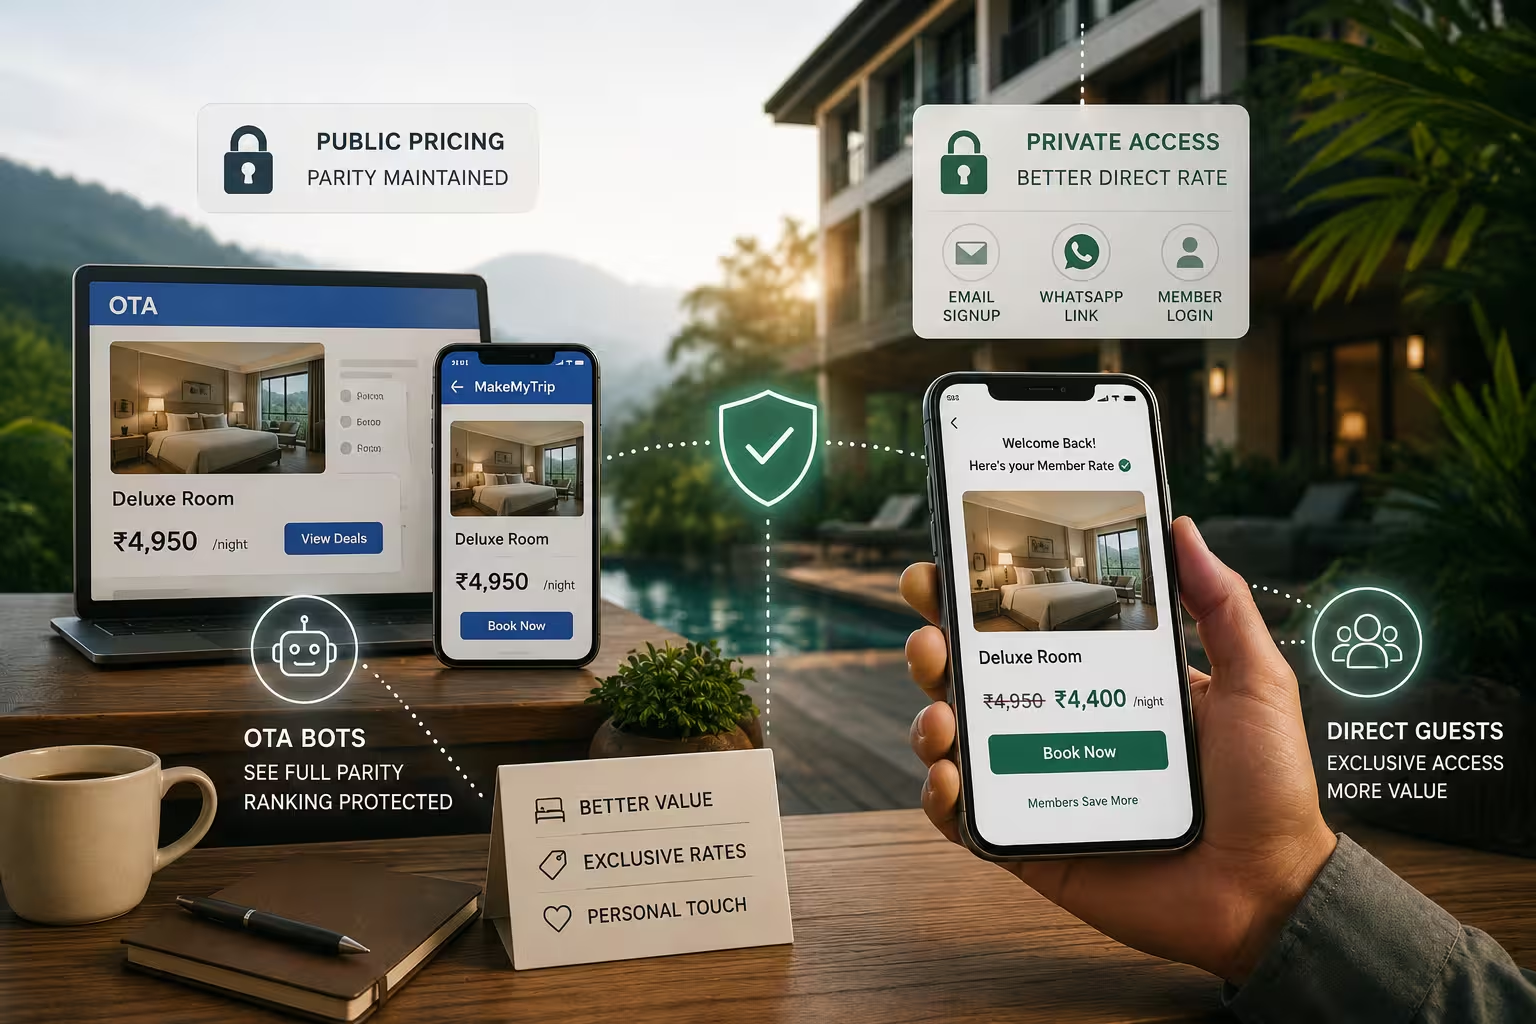
Direct bookings through WhatsApp, secured via UPI payment, carry none of these costs. Zero commission. Instant settlement. The guest relationship belongs to the property.
NRevPAR (net room revenue after all distribution costs, divided by available rooms) is the metric that reflects this reality. A property reporting strong RevPAR on the back of heavy OTA dependency may be generating meaningfully lower NRevPAR than a property with slightly weaker RevPAR but a strong direct booking mix. The difference is the actual net yield that flows to the bottom line.
Capping OTA inventory contribution and closing OTA availability during periods of forecasted compression are the operational mechanisms that shift demand toward direct channels. Indian guests, who routinely use OTAs for discovery and price benchmarking then contact properties directly via WhatsApp to negotiate, give independent properties a practical channel to capture that transition. A direct booking incentive offered through WhatsApp (a 10 percent discount, a complimentary late checkout, a welcome amenity) is shielded from OTA rate parity compliance because it's transacted privately, and it converts a commission-heavy booking into a zero-commission transaction.
The Real Reason TRM Fails in Implementation
The failure of total revenue management in implementation is rarely about understanding. Most commercial teams know non-room revenue matters and that distribution costs affect profitability.
The failure is organizational. TRM requires the revenue manager, F&B director, sales director, and GM to share a commercial objective. In most independent properties, they report through separate hierarchies, use separate systems, and are evaluated on separate metrics. The revenue manager's bonus tracks RevPAR. The sales director's tracks contracted event revenue. None has a direct incentive to optimize for GOPPAR.
When a large event inquiry arrives, the organizational pressure to close it usually wins. The displacement analysis, if it happens at all, happens after the rate has been offered.
The most practically useful change a property can make is a weekly commercial meeting where the revenue manager and sales director jointly review the displacement economics of any pending group inquiry before a rate is offered. That process, requiring no new technology, delivers more TRM value than most software implementations.
Where to Start This Week
TRM is not a system to be installed. It's a discipline to be practiced. For most independent properties, three changes create the largest immediate impact:
Measure NRevPAR alongside RevPAR in every weekly commercial report. Calculate total room revenue minus all channel commissions and distribution costs, divided by available rooms. The gap between RevPAR and NRevPAR is the cost of your current channel mix, expressed per available room. Watching that gap change over time is more commercially useful than watching RevPAR alone.
Establish a displacement protocol for group and event inquiries. Before any rate is offered on a group that would occupy more than 15 percent of inventory on a high-demand date, the revenue manager and sales director must jointly complete a displacement analysis. Build a simple shared spreadsheet to do this. The format matters less than the habit of doing it before the commercial conversation begins.
Run one RevPASH calculation for your highest-revenue F&B outlet. Divide last month's total outlet revenue by the number of available seats multiplied by total opening hours. Now look at where revenue is actually concentrating by hour. If 60 percent of your outlet revenue is occurring in 20 percent of your operating hours, you have a duration management problem, not a pricing problem. The answer is throughput engineering, not menu changes.
The Metric That Was Never Measuring What You Thought
RevPAR is not going away. The industry will continue benchmarking against it. What needs to change is the assumption that growing RevPAR is synonymous with improving the financial health of the property.
The bidirectionality finding in TRM research is the most uncomfortable truth in modern hospitality commercial strategy: a property can simultaneously be winning on RevPAR and losing on GOPPAR, under conditions that are common, not exceptional. Heavy OTA dependency, static F&B pricing, undisciplined event displacement, and siloed departmental objectives all contribute to this outcome, and they're present in most independent properties right now.
TRevPAR strategy doesn't require a new platform. It requires a different question at the commercial briefing. Not just "how is room revenue performing?" but "how is total property revenue performing, and what did every booking actually cost us to acquire and service?"
The answer to that question changes what decisions get made, what events get accepted, and what channels get prioritized. And those decisions, made consistently over a full year, have more impact on property profitability than any rate management software implementation.
Ready to build a total revenue management strategy tailored to your property? Grow Engine works with independent properties across India and globally to implement revenue management and commercial systems that fit your market, your guests, and your goals. Get in touch today through https://www.growengine.in/contact.